For such an operationally-focused industry, the aggregates sector is very poor at planning … especially sales and operational planning (S&OP). This isn’t really that much of a surprise, because most aggregates managers would rather be out and about in the quarry or the marketplace making and selling their products, rather than sitting in the office making plans. However, S&OP is a key part of any company’s success. Join our experts from Commercial Performance to find out why planning is so important. What are the most common issues and problems?
If you don’t know where you’re going, how will you know when you get there? The truth is you won’t … which is why planning is essential if you and your business want to succeed. We plan to fail when we fail to plan. Sales and operational planning (S&OP) is the best way forward. It is, says Commercial Performance, “essentially about matching supply with demand to reduce uncertainty.”
The “sales part is about understanding demand or more simply sales forecasting. This is where S&OP starts. The operational part is about inventory and supply chain management … looking at things like product flow, primary and secondary stock levels and pit balancing decisions.”
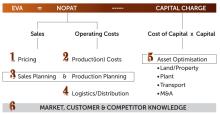
This is the third feature in our series of Six Deadly Sins and, says Commercial Performance, “the principles involved are no different to those in our previous two features on product costing and pricing … the single most important thing we can advise you to do is to sit down and take time out to consider the pitfalls of not doing S&OP well.”
When you do this, say consultancy experts at Commercial Performance, you will quickly “realise the serious impact it can have on your business, namely, the destruction of value and the creation of unhappy investors due to high stock levels, increased by-product waste, missed higher pricing and lost market opportunities … to name a few.”
And, “what is surprising, is that doing S&OP well only requires discipline around a few key factors to avoid such pitfalls. Let us help you to create happy investors and generate wealth. So, let’s take a look at these … starting with sales forecasting and its essentials:”
1. Know your customer and your market. Any forecast requires pertinent knowledge and a sales forecast requires good knowledge of demand from each customer in the market. It sounds easy, but how many sales teams have really ‘good’ knowledge of their customers and their customer’s customer? How many capture the information on even the most basic CRM (client record management) system? This is often the place where the sales forecasting process begins to fail … the point at which teams often fail to have a good grasp of buying behaviour. The basic minimum you should know is volumes and prices by product type and by quarry … but you will also need a good grasp of things like how your customers tend to negotiate and demand discounts by product or by project. This is especially critical in the case of large/multiple tenders or where the customer’s customer can change or influence specifications. Understanding this ‘supply chain’ is invaluable, particularly in highly fragmented and dynamic markets. Great aggregates teams use technology to capture sales data. They find out all about other buyers’ intentions and they know where the trigger points are in the decision-making chain. And they do this consistently. Just like a supermarket, successful aggregates teams know what their clients generally buy and they know exactly how the market responds to certain incentives. Do you?
2. Establish a sound, reliable process. A robust process only needs some basic elements, but again we often find these are either missing or poorly thought out. The first is customer and product classification … and segmentation. It often surprises us at Commerical Performance how often these are not in place. Not only does this highlight crucial gaps in customer knowledge but it also highlights a lack of a common understanding or a shared language for a company’s products. Something is lost in the chain between production and sales. The second element is a combination of both the time horizon that your business employs and the frequency with which you review and/or update your processes. The decision on how far ahead to forecast for operational planning reasons is often linked to the budgeting process. The standard approach is yearly and, if you’re lucky, things get reviewed quarterly. However, out in the real world, the nature of the customer base, order patterns and delivery lead times in dynamic markets with a high percentage of small project work may mean that bi-weekly and even daily updates are necessary! When you review your forecast tracking, do you learn and correct as you go? In fact, does anyone actually review? And on what basis? Do you use a rolling 12 months to improve smoothing effects, or do you remove exceptions? The final element is the sandbagging .... when top-down targets meet bottom-up analyses to settle on a number! The worst sort of compromise.
3. Involve a diverse range of independent thinkers. It has been shown in many industries, most notably the FMCG (fast-moving consumer goods) sector - which is arguably far harder than the building materials markets to forecast accurately - that involving a diverse group of independent experts helps to remove bias and groupthink … and to challenge the poor assumptions that are often made in most forecasts. The classic lazy assumption is increasing last year’s sales figures by a few percentage points to match the numbers in the budget. That’s it … forecast done! This laziness is often a precursor to bias when you get a group of sales people together who have similar types of customer base. One will say “my sales should be roughly 5% up on last year” because he/she has seen their targets and the other person just simply agrees: “Yep, that’s about right.” Too often it’s a case of “job done … let’s move on”. Involving a diverse group to test assumptions robustly helps teamwork. You will be surprised at how clearly they need to have some knowledge of the aggregates market … but what we mean here is involving other sorts of people in the business … for example, people from the credit control department or the quarry weighbridge. They can often have a good insight into market dynamics, and raise issues that you would not otherwise have considered.
4. Accept a degree of inaccuracy. When we talk about forecasts there is one caveat we must accept; you will never be 100% accurate. But don’t use that as an excuse to not bother. We have seen forecasts more than 90% accurate, but never 100%, so it’s a trade-off in terms of gathering pertinent knowledge and the time/effort put into capturing it. The more transparent and factual the information you gather from your customer base, such as forward orders, the more accurate you will be.
5. Make the forecast a key part of the business routine and cycle. A great forecast on its own is useless. It should not be an isolated thing, left alone like a budget that has been put in a drawer and not looked at again until budget review time. It is an essential tactical decision tool, especially when it has been jointly signed off by - and reviewed with - operations/production. A good forecast leads to an optimally balanced pit that is maximising its sales potential. It will also help you formalise key decisions … such as when to say no to a customer. The sales forecast will also become more firmly established and used if it is linked to sales and marketing plans at the tactical as well as at the strategic level. Use it to develop and validate budgets and portfolio decisions, as well as the consolidation of supplies when two, three or more pits are close together or used to supply the same customers … such as in RMX.
For such an operationally-focused industry, we seem to be very poor at sales forecasting and operational planning. Just like the advice we gave in our previous articles on product costing and pricing, most of this article seems rather simple and straightforward ... if not common sense. More often than not the reality is, however, that we get a general ‘fail’ score in this category as an industry.
When thinking about the aggregates industry and how fixated some people are with volume, as opposed to profit, a television advertisement from the early 80’s always springs to mind.
It goes like this: A farmer in his 70’s is leaning on his pickup, parked on the side of a country road and the pick-up is stacked high with pumpkins. Beside the pick-up is a sign: “Pumpkins $1.00.”
A young, keen financial planner pulls his car up behind the pick-up and gets out of his car. He approaches the farmer selling the pumpkins. “How’s business?” he asks.
“Yeah, really busy … selling lots,” replies the farmer.
“So, you’re making plenty of money then?”
“No, actually,” says the farmer.
“Well then, let me help you out … How much do you buy your pumpkins for?”
“One dollar each.”
“Ok, and how much do you sell your pumpkins for?” asks the planner.
“One dollar each.”
The planner thinks for a little bit and says: “I think you need a bigger truck”.
This could easily apply in the aggregates industry. So many aggregates managers think that the answer to better profitability is to produce more. Very seldom is that the case.
The argument that we are a volume-based industry works only to a point, and then it becomes negative; negative in every long-term metric you want to use and, most importantly, negative for economic value added (EVA).
For so many in our industry, more is more. If we actually forecast and plan correctly, the adage ‘less is more’ can be very true. Measure the success of your business by its profitability and - as the theme of our articles states - EVA.
This series of articles looks at ways to ensure we don’t destroy the long-term value in our business, especially by making short-term decisions that may have a negative outcome many years ahead. Keep it simple. Forecast what you are going to sell, and then have the operations people make those products in the correct volumes.
Be honest. How many of your operations have well-structured communication systems with their commercial counterparts? How many of the operations people, and commercial people have the data to make informed decisions?
Sales forecasting
What exactly is a sales forecast?
Is it what happens when your sales team gets together and tells production what has been sold? Is it an arbitrary value that was determined last October in the budgeting process?
Do you have any mechanisms in place to look at the long-term, or even short-term profitability of your sales forecasts? How do you decide whether or not to accept an order?
For example, your business has accepted an order for a high-value’ single-sized aggregate. You have established that the production cost of the aggregate in question is $5.00 per tonne and a sales order has come through for 30,000 tonnes. Everyone looks happy and the sales team is celebrating the $25.00 price tag they got for the bid.
The trouble is that no-one is looking at the fact that the yield of this high-value aggregate is only 10%.
We are not saying in this example: “Don’t make the sale.” We are saying please don’t fall for the common mistake of saying: “I made a $750,000 sale where the production costs were $5.00 per tonne x 30,000 tonnes = $150,000 … therefore I made the company $600,000 profit.”
Yes, you have achieved $750,000 of revenue. But, if you were going to try and look at each sale in isolation, you would have to say that the 30,000 tonnes of product you sold needed 10 x that tonnage extracted from the ground to produce the end-product required (remembering that the yield of the high value aggregate was only 10%).
So, in simplistic terms, there were 300,000 tonnes of production costs that went into quarrying and making that particular order. Perhaps a better way of stating the outcome of the sale would be: “I sold 30,000 tonnes of high grade aggregate for $750,000, it cost us $1.5 million to make the product, but we have 270,000 tonnes of other aggregates sitting in inventory that have half of their production costs covered.”
Of course, those other aggregates that were produced as this high-value aggregate was manufactured will eventually be sold, and yes, you cannot look at one transaction in isolation. But, with a group of products, over a period of time, this becomes important.
There are many clichés in aggregates: ‘Sell what you make, don’t make what you sell’, or, ‘sell the curve’. What is being preached with these clichés is that pit balance, or balanced inventory is one of the keys to profitability, in the long and the short term.
Where does this problem start? And how do you fix it?
As a sales team in aggregates, do you take these things into consideration when forecasting?
Do you have the knowledge and the tools to be able to say no to some orders?
Are you aware that accepting some orders will lose you a lot of money?
Of course, there are pressures to achieve monthly sales volumes and targets – but breaking profitability down into these small periods of time often leads to negative long-term decisions.
The following graphs indicate different profit scenarios during a year. Please refer to the first article in this series about product costing if you want to fully understand what product costing entails.
In this first graphic we see the total product cost in red, and the sales price in green. This graph, and the following graph are not chronological, but show cumulative lines as tonnes increase. In this example, we see that the price does not intersect the cost line until near the end of the number of tonnes produced. Whenever the price line crosses the cost line, the product is being sold at a loss. Carrying on to the same graph below, we can see the shaded area represents the margin or profit for that product, for a given amount of tonnes produced AND sold.
And the white arrow in the shaded area shows the tonnage produced AND sold that will give the greatest profit for that particular product. Of course, these linear graphs do not reflect chronological reality. However, they are critical to establishing at which point the right volume of production and sales mix to make the most profit. Remember, we are a long-term business, and we need to be trying to achieve maximum profit for every tonne extracted. In the example above we sell nearly everything we make. However, if we were to say sell only half of what we make, the result would look like this:
There are many products in a quarry … in most cases, too many. Each one will have its own individual fingerprint or graph. Each one is vitally important. Of course, the optimal product/sales tonnage will be different for each product. The key is to combine all the products and understand the envelope that makes your pit or quarry the most profitable. And it all starts with sales. Depending on the price, and the projected profitability, should your sales team really be taking that order … or should they be saying ‘NO!’? Our experience is that our sales and commercial people are not given the training or the tools to be able to see the full picture. You need to educate them, so that they can make the best decision in most circumstances.
Your budget: is it doable?
A great place to start looking at your profitability is your very first sales forecast for the year. Yes … your budget.
How many budgets are prepared with pit balance in mind? This, after all, is your target … and it is what you will be measured against. It is what drives your performance metrics.
Does your budget make sense?
Are your products/product yields
split up?
What can your production unit deliver?
One common mistake, when setting a budget in the aggregates sector, is that the split of sales by product does not match the split of products by production. What happens then is a common mistake.
It goes like this ... finance will add up the total revenue from the sales budget/forecast, and subtract the production costs for that number of tonnes. Bang. Straight away, there is an imbalance. And even though there may be some adjustments to correct for this in the beginning, experience shows us it is never enough. If this is the case, you are fighting a losing battle from day one, and only a pick-up in sales volume and/or price will bring you home at the end of the year.
When you are forever chasing a single product, or a group of products, you will always get yourself out of balance. When you are out of pit balance, your costs tend to exceed your budget.
Inventory management
The aggregates industry is going through exciting times. As an industry, we have been slow to adopt new technologies, and a lot of sites don’t even have decent connection speeds for the internet. However, a change has rapidly occurred in the past three or so years, and that is the mass adoption of drones and imaging technology. What is the reason for such rapid mass adoption?
Maybe it’s because we like toys. Maybe it’s because the industry is changing its age profile and a more tech-savvy generation is now in charge. Whatever the reason, we need to embrace it because the use of imaging, especially on a frequent basis, presents us with the ability to manage our business so much more effectively.
Keeping in line with this article’s theme of sales forecasting and production planning, what does this technology uptake mean?
It will influence many facets of the business, but the one aspect that we want to mention here is inventory management. With more frequent imaging of stockpiles, we obviously have greater transparency of stockpile volumes. This is good news for the finance department and very useful info for the sales and production teams.
However, there are great new tools being produced that take the stockpile measurements and actually predict future inventory levels. This prediction goes out as much as 12 months ahead, and is a powerful tool when considering:
1. Production scheduling
2. Capping limits or working capital alerts
3. Seasonal stock levels
4. Pricing issues relating to inventory
Supply chain management thought process
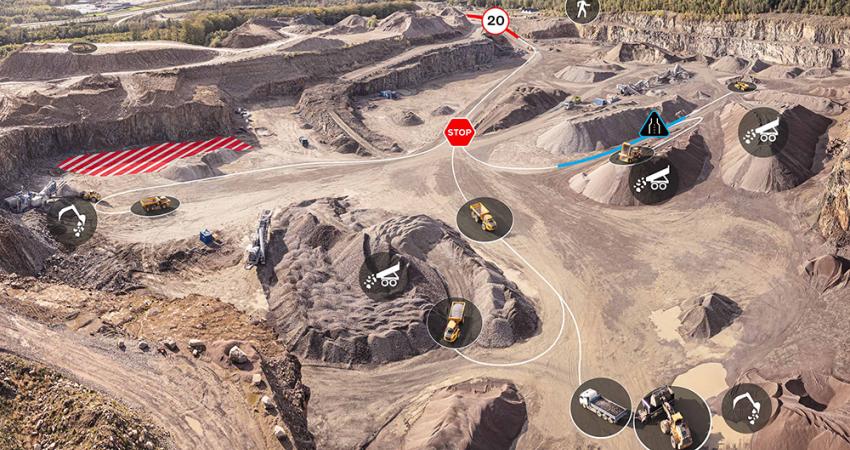
Think of your quarry as a warehouse ... a warehouse that nature has sorted and stacked, but a warehouse all the same. All we have to do is to dig, drill and blast the material out … and then haul it off for processing.
You need to know your quarry in detail. After all, what would you think of a warehouse manager who did not know where things were in his or her warehouse? Can you imagine the bedlam as items were randomly selected and moved to find the ‘useful ones’?
And yet this sort of bedlam is the state of play in many quarries … particularly when you start to factor in overburden removal requirements (a key cost-driver). There is no need for chaos however. Map it out. It couldn’t be simpler:
1. You work out what rock types are where in the quarry.
2. You work out what can be made from each rock type and what the resultant yield is.
3. You determine how many hours in the year you can operate (based on licence, site configuration and so on).
4. You determine the production capacity of your loading tools and haulage fleet.
5. You use a scheduling tool to work out what needs to be moved from where and when to meet the sales plan.
6. If the scheduling model says you can’t meet the sales requirement, you look at a different scenario and re-run the schedule.
It is not always as easy as this but this is a worthwhile pattern to follow. We have had great success adopting a class-leading mining scheduling engine for use in quarries to carry out exactly the sort of analysis noted above.
We have used Deswik.Sched Gantt chart scheduling software to enable our clients to determine (in conjunction with sales) what material is available, in what quantities, from which sites … and to understand when it could be made available in the market.
Packages like these also help managers understand how much overburden needs to be moved and when this needs to happen. Different ideas can be run as separate scenarios to give both operations and sales managers clear forecasts of what is possible. By way of example, one client found (using this approach) that they could satisfy the requirements of a major sales contract for a period of two years but would fail in year three without a significant overburden stripping campaign.
Knowing this, they were able to factor this requirement into the price and the operational budget. The takeaways from this were that operations knew what they had to do and that they needed to find dumping space, that management had a heads-up on major capital costs ahead of time and that sales received the word that they needed to do everything they could to find a major fill project. They knew from day one that they had to sell the overburden in order to reduce the dumping cost. This was a win-win for all concerned.
Nature hasn’t always been the most organised warehouse manager, but if you give her a hand by applying some scheduling technology, things will soon start to sort themselves out. AB
As with previous articles in the Six Deadly Sins management masterclass series, you can find out more by contacting our expert authors at: [email protected]

